How to 400x your company revenue
:case study:
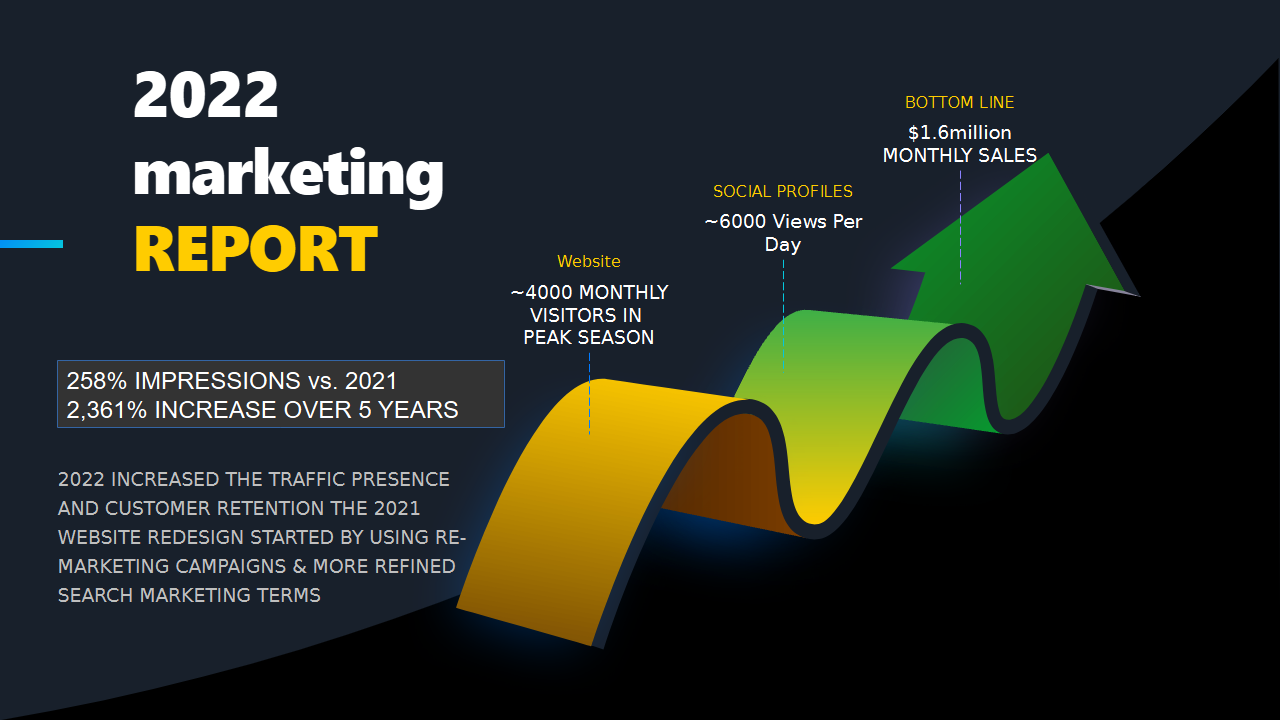
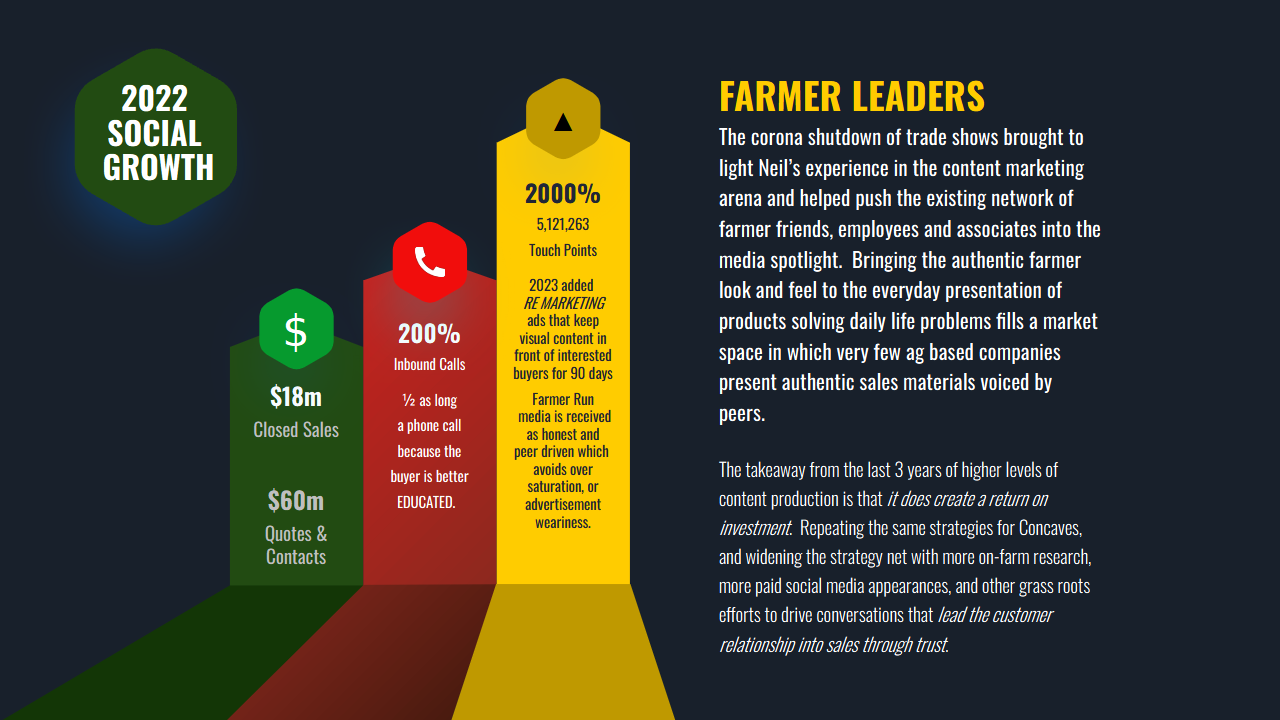
We doubled the company gross sales revenue in 2020 despite missing the consumer contact in tradeshows because of COVID.
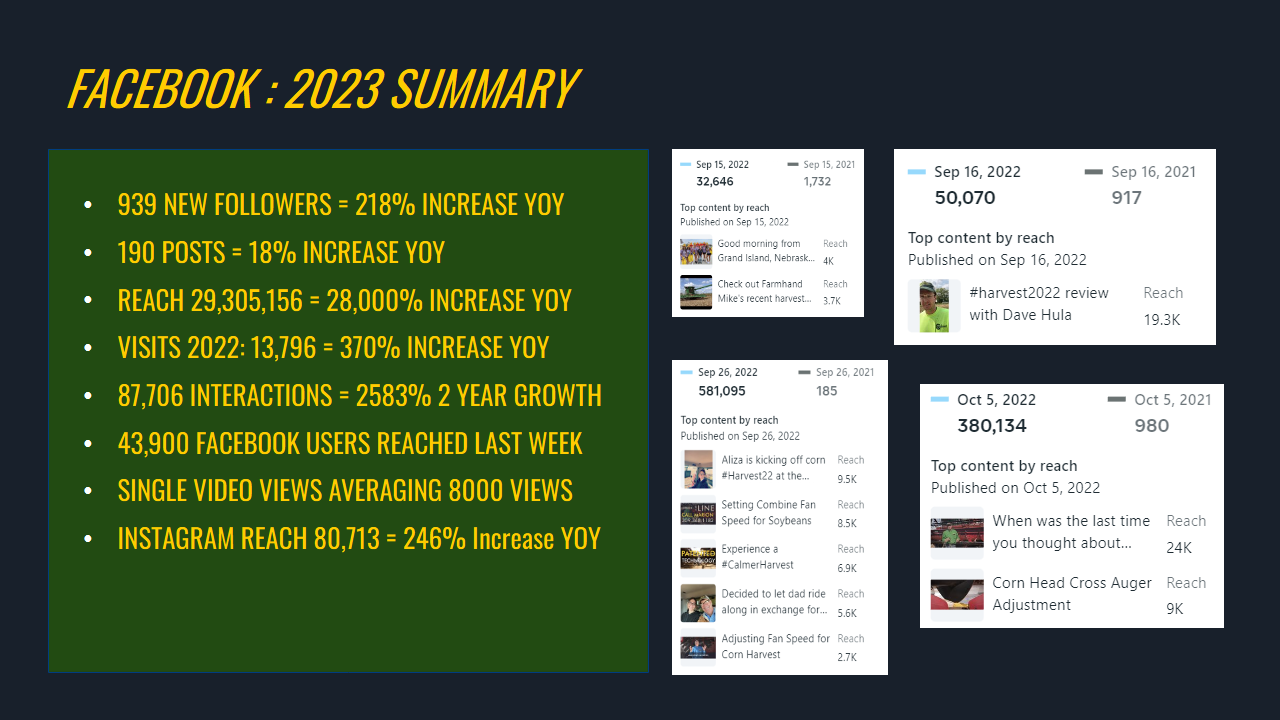
Media & publishing efforts increased the reach of the company by 28,000% while not increasing spending!!
2021 Gross Revenue Growth 209%
Website redesign & media stategy buildout.
2022 Gross Revenue Growth 218%
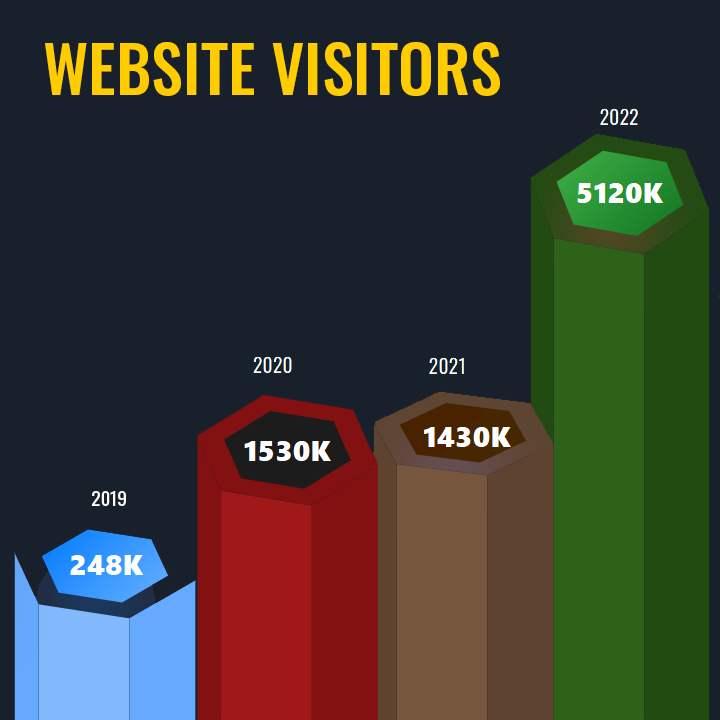
Website traffic results and full social media engagement.
Own the Media Lifecycle
Media production is expensive on the surface, but in this case study’s 2020 time period we see the isolation of direct to consumer contact cease and potentially destroy the sales cycle. Instead, through grass roots media development we produced 200% revenue growth and astronomical impression numbers feeding an extra hungry media market because of lower contact during COVID. Convert your business mindset to a PUBLISHING BUSINESS MODEL, and look at the platforms as the paper of the previous age. The paper is free now, you just have to have engaging content to publish. A creative director like Neil makes producing the messaging easy and painless.
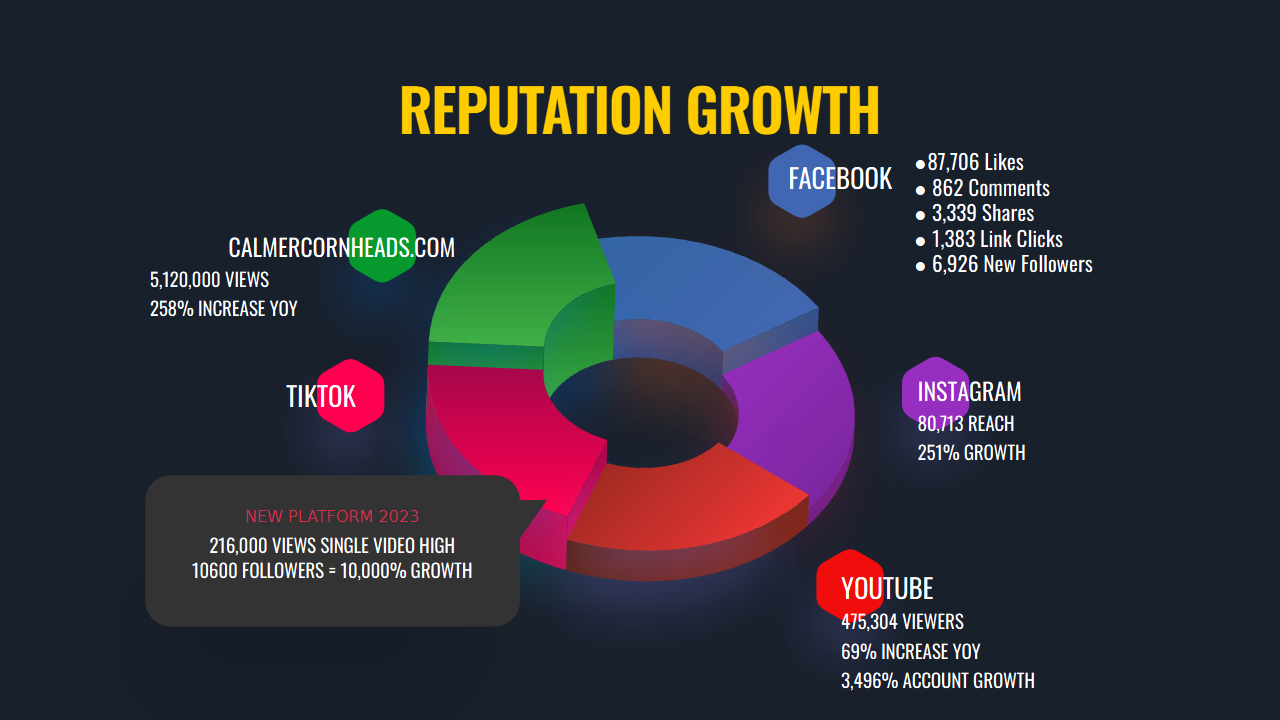
Reputation Growth over 3 years:
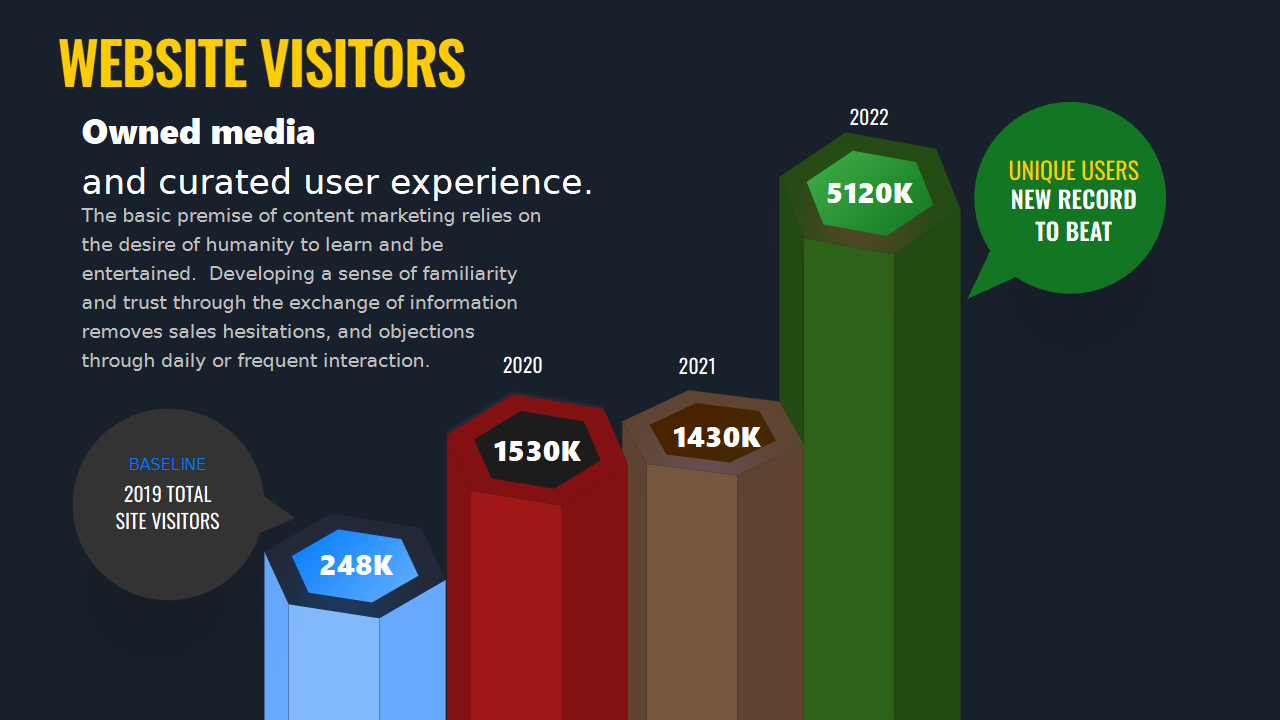
- + 1840% increase in website visitors
- + 3496% YouTube channel growth
- + 28,000% Facebook Impression Growth
- + 29,000% Facebook Reach Growth
- + 80,700% Instagram Reach Growth
- + 252% Year over Year growth Instagram
- + 10600% TikTok follower growth in 6 months
How does Media
pay for itself?
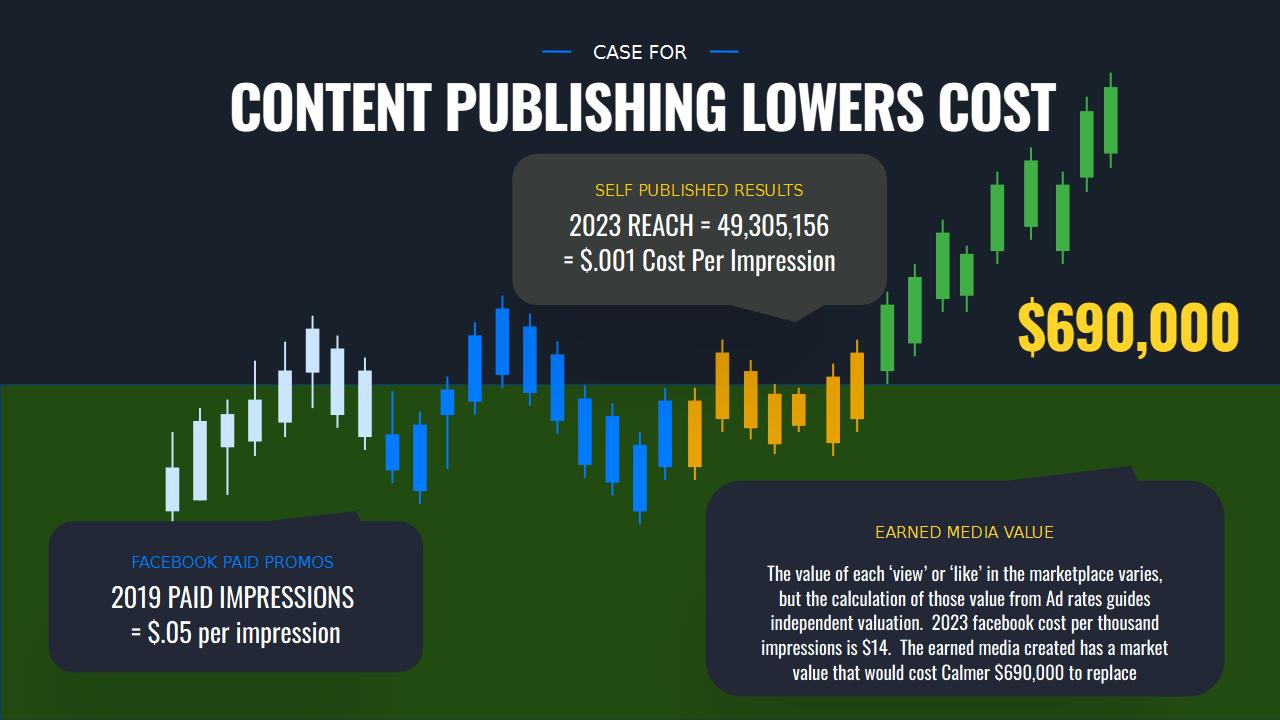
Let’s take the case of the first ‘viral’ video clip from Calmer about the “Largest Corn Head Ever Produced” = 1.2million accumulated views. The video clip of the largest combine header operating in the field cost roughly $4500 to make. But the views it garnered online were worth $60,000 in paid media exposure. Collectively, the media publishing strategy produced $690,000 in annual advertising value calculated at each customer touch costing $.05. That’s $500,000 profit from an investment of $160,000! So the internal rate of return is nearly 5x, and now you’re developing a GAP principle for your marketing & sales expenditures that can show you when you hit a ceiling.
Produce your content to meet the market taste and interest – the cost for production and publishing will be totally offset by the ‘earned media’. Earned media is a term to add to your business management toolbox which in it’s highest form is user generated content.
Invest in production
and Analize the ROI
No WEAK LINKS
In today’s highly evolved media marketplace a lot of space for a company to close gaps and reach new customers. We can get as granular as seconds spent on a website to see the broken pieces of the road to sales. Calmer Corn Heads was a traditional manufactured product in the conservative agricultural market with a Lexus price point and an aweful website that looked amateur. The same content marketing plan was proposed to the marketing director in 2014 who was the owner’s brother – and it was shrugged off with zero understanding of the media market as well as what Lexus taste and style were. If we define the decision to turn down a content marketing plan as opportunity cost:
That decision lost the company 10 million annually over the span of 2014 to 2020
COVID Forces Change
Because of the cancellation of person to person contact brought about by COVID shutdown of the trade show circuit, the conservative company took a perceived risk in producing more content because by traditional business operation standards one would choose the linear option of cutting costs to increase revenue. Fall of 2020 marks the start of full scale content creation. Unfortunately, we were feeding traffic to a poorly designed, zero SEO, and not quite mobile friendly company website. But for comparison, the breakthrough video of October 2020 was viewed 600,000 times – for an earned media value calculation from a $.05 a view totaling $30,000 in advertising credit – or 10x the cost of production in the value created.
Campaign Results worth $690,000
Campaign Cost to Produce $180,000
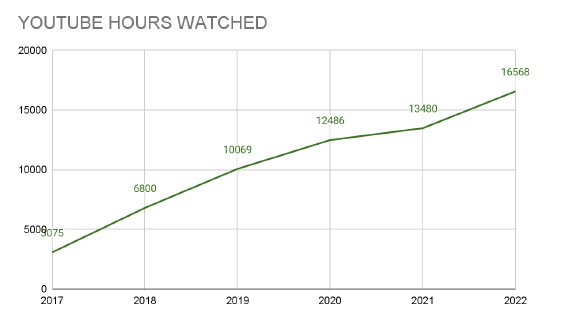
Youtube Hours Watched Growth
Can your business claim to have 16,568 hours of customer engagement? Can you realistically assess a 3496% increase in time spent learning about your company and it’s benefits? You will be able to sense the changes in customer behavior when offering that amount of video content.
994,080 Minutes of Engagement in 2022
Drove an educated consumer to the phone to place the order for the $20,000 of agricultural equipment. The sales team reported the average time on the phone dropped by about half to a quick ten minutes of data exchange, instead of question after question before a sale was started.
Owned Media Results
227,200 Views:
@calmercornheads Marion, a long-time no-tiller, talks through the results of his soil stratification study as he pulls a plow for the first time in decades. #MarionCalmer #NoTill #Tillage #ROI #Calmer #AgTok #InstaAg #AgBook ♬ original sound - Calmer
10,000 followers
in 180 Days
In August of 2022 the agricultural company did not have a TikTok account and some FFA students suggested we do so. Little did we know, that the majority of #agriculture discussions between farmers were happening on the TikTok Platform!
The majority of working farmers hover in the 35-65 year old age range. Starting with a working understanding of what the average farmer is using TikTok for – is how to build an effective audience based on the market – not on frivolity. Farmers generally operate solo, with long hours in the cab of a tractor – or doing the mechanical upgrades and maintenance to keep all of their machinery running.
Thus, their social hour – is on TikTok. Because so few other careers share their time restraints, remote locations, and unique challenges TikTok became the watercooler in a smartphone in the agriculture industry.
But don’t think it’s limited to petty gossip like most water coolers. Farmers are learning from each other outside of their regions because of the digital connection. Farmers are sharing marketing timing updates and troubleshooting complex problems together creating a wiser hive mind in the process.
If the majority of your market audience is using a certain platform, you better be there in contact with them. The above embedded video presents hard research data about soil nutrients and has 227,200 views – 10,900 likes – 2800 ‘shares’ (send to a friend) – and 1099 saves. For a company that only ships about 1400 orders a year – having 2800 audience based shares (to other qualified audience members) in the offseason is an earned media win!
The TikTok account was started in September of 2022 and by January of 2023 had 10,000 followers 40,000 likes and a 7% Avg Engagement Rate as assessed by VidIQ.
Publishing Business Model
You won’t find another company in Ag who has published over 200 pages on it’s website with video assets meshing text and video content into a rich media experience tuned to helping farmers solve real world problems in their complex harvesting machinery. If you had relied on the ‘boss’ you would have published one 20 minute video telling the world everything you knew and it would be watched 1500 times. If you trust me with your media, you plan & create a rich content net developed from reverse engineering the google adwords and related market insight. If you read the news, you’d know that Youtube is the second largest search engine on top of being heavily favored by Google so all of your ‘answers’ would be in video format, starting immediately without bumpers or delays at getting to the point. The advent of ‘platforms’ still rely on ingenious creators to provide interesting material; but it brings the ability of any business to outpace the media it’s currently advertisng in – and go straight to their consumer. In Calmer’s case–the website we built drives 1000% more traffic than ANY of our paid advertising channels.
2022 Facebook Growth
● 87,706 Reactions/Likes
● 83,505 Likes
● 862 Comments
● 3,339 Shares
● 1,383 Link Clicks
● 6,926 New Followers
28,000% Increase YOY
- 2022: 29,305,156 Impressions
- 2021: 103,101 Impressions
370% Increase YOY Page Visits
● 2022: 13,796 Page Visits
● 2021: 2,933 Page Visits
Page visits are unique landings on the facebook page as compared to a single view of independent content anywhere in a facebook feed. The clickthroughs to find out more information, find the phone number and the like are through the roof – showing that the social media content drove customer interest beyond just a single view or ‘entertainment’ value.
28,000% Increase YOY in Page Reach
Again defining the facebook ecosystem as a messy one – the offering of topic relevant, brand story content, and a niche customer base makes reaching similar customers a free goldmine for prospecting new business.
● 2022: 29,305,156 REACH
● 2021: 104,319 REACH
